B2B Sales Reporting: From Static Spreadsheets to Decision-Driving Dashboards
Why static monthly reports fail leadership reviews and how to structure dimensional drill-downs for actionable revenue planning.

TL;DR
- The sales report that arrives as a file at the beginning of the month answers what happened, but it does not let you ask why. That is why it rarely changes commercial planning.
- A useful dashboard is not the one with the most charts. It is the one that organizes data across a few core management dimensions (account, product, channel, rep, territory) and lets you drill down to the order level.
- Three questions guide the design: what decision the dashboard helps make, who makes it, and how often.
- The practical test is whether the dashboard can answer, in a single meeting, why a target was or was not hit, without asking for another data pull.
A B2B sales report supports commercial planning when it stops being a static file with aggregate totals and becomes a dashboard organized by the dimensions management uses to make decisions (account, product, channel, rep, and territory), with the ability to drill down from a total to the specific order behind it. The static file shows the outcome. The dashboard shows where to take action.
Every sales leadership team knows the routine. By the fifth of the month, the spreadsheet for the previous month arrives, complete with tabs by territory and sales rep. Someone asks why the Midwest territory dropped. Answering requires another data pull, which arrives the following week, well after the meeting has ended.
Why static reports do not change commercial planning
The static file has three structural limitations:
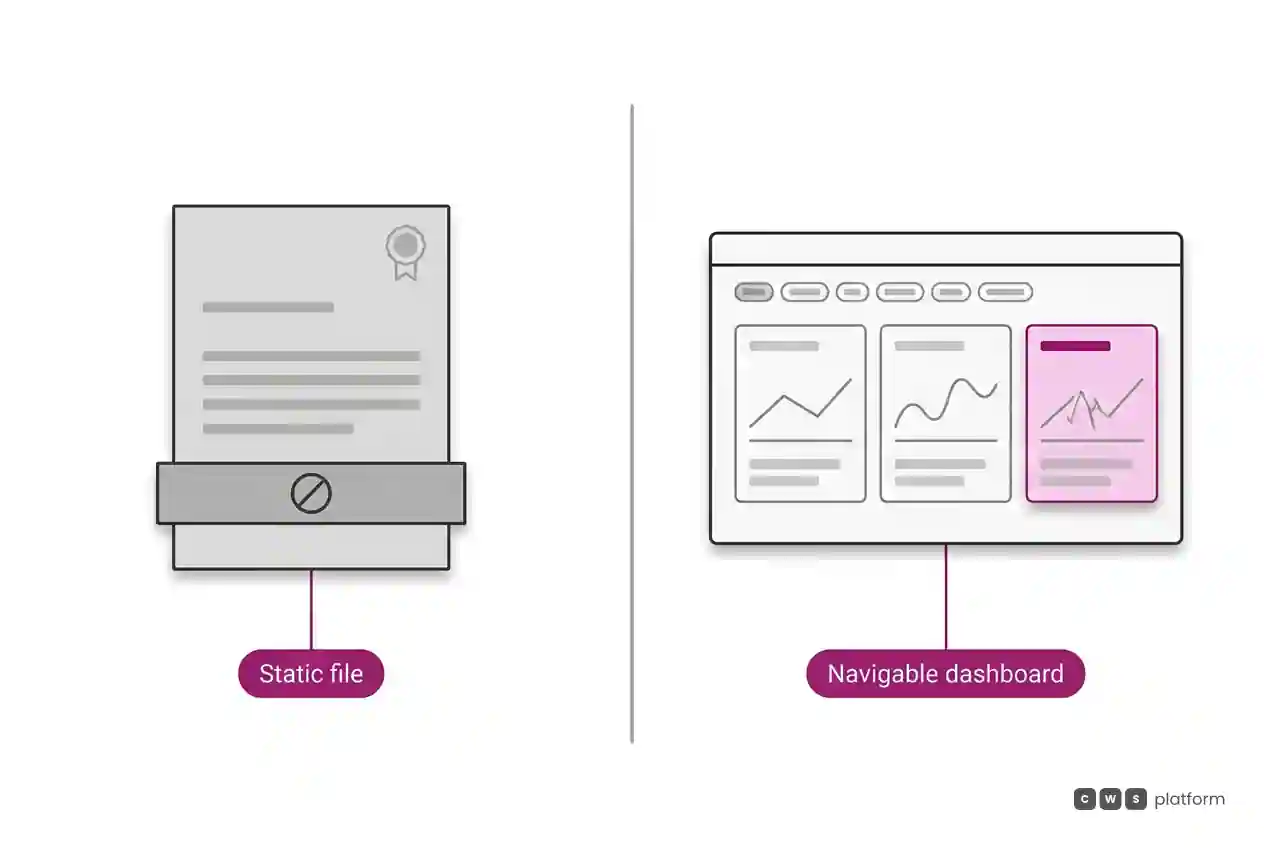
- It only answers what was asked beforehand. The tabs were built months ago. A new question does not fit into them.
- It stops at the total. It shows that revenue from an account dropped, but it does not show which SKUs the client stopped buying or whether they shifted orders to another channel.
- It arrives too late. By the time the analysis is ready, the window to act within the month has already closed.
As a result, commercial planning continues to rely on last year's numbers plus an arbitrary percentage, and the report serves only as a check, not as a driver of decisions.
The management dimensions that organize a dashboard
A useful dashboard translates charts into dimensions that management immediately recognizes. In B2B, five dimensions cover the vast majority of commercial decisions:
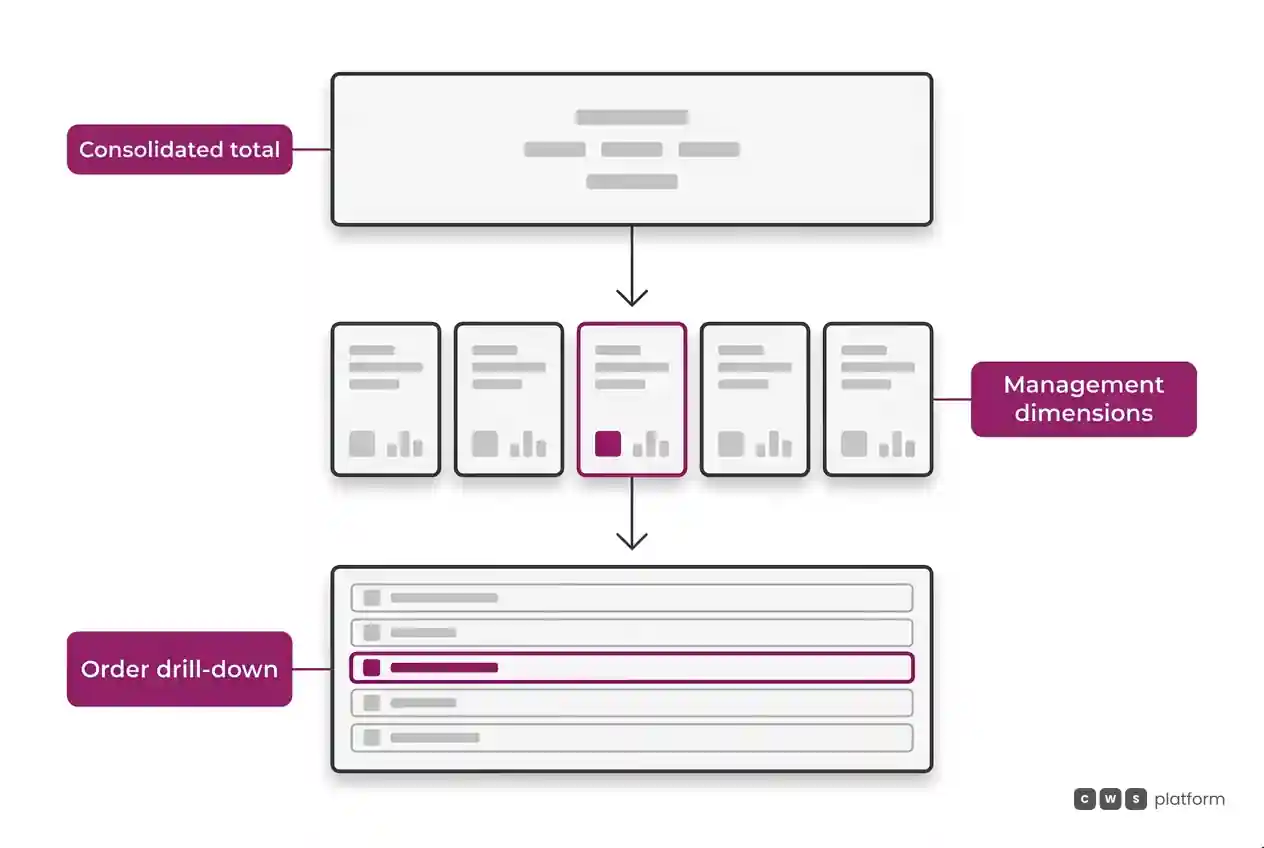
- Account: who is growing, who is declining, who stopped buying, and how much margin each contributes.
- Product: category, mix, and the items being added to or dropped from each account's orders.
- Channel: customer portal, independent rep, inside sales, marketplace, and customer migration between them.
- Sales rep and book of business: volume, realized margin, average discount, and the share of digital self-service across their accounts.
- Territory and branch: coverage, product availability, and cost to serve by market.
Every number on the dashboard should allow drill-down: from territory totals to accounts, from account to orders, and from order to line items and applied commercial terms. This drill-down capability turns "the Midwest dropped" into "three accounts in the Midwest stopped buying a specific product category following a pricing update."
Three questions before designing any dashboard
1. What decision does it help make? Reallocating account books, revising pricing for a product line, prioritizing account reactivation. A dashboard tied to no clear decision becomes visual clutter.
2. Who makes that decision? The VP of Sales needs a view by territory and channel. The sales manager needs to see the rep's book of business. The sales rep needs visibility into their assigned accounts.
3. How often? Quarterly planning, monthly adjustments, weekly pipeline and account reviews. Frequency determines the necessary level of detail and data refresh rate.
From dashboard to commercial planning
Commercial planning changes shape once this level of visibility is in place:
- Targets broken down by account and product family, rather than just by sales rep.
- A reactivation plan, complete with a list of accounts that reduced purchase volume and the probable operational reason.
- Product line pricing reviews, based on realized gross margin rather than list price.
- Channel strategy, identifying accounts ready to transition to self-service digital ordering.
In practice, the first win of a well-designed dashboard is not an attractive new chart. It is changing the agenda of the monthly sales meeting: instead of debating whether the numbers are accurate, leadership discusses what actions to take. To achieve this, the underlying data must originate from orders captured with account, channel, rep, and applied commercial terms attached, which only happens when sales operations run through an integrated platform rather than spreadsheets. This is the foundation that the Sales Hub from CWS Platform organizes for sales teams, while deeper insights into account-level profitability are covered in margin and commercial decisions.
Next step
List the three questions your last sales meeting failed to answer using the available reports. For each one, identify the missing dimension (account, product, channel, rep, or territory) and the level of drill-down required. That list defines the exact scope of your first actionable dashboard.
Frequently asked questions
What should a B2B sales report include?
Revenue, realized gross margin, and volume organized by account, product, channel, sales rep, and territory, with the ability to drill down from high-level totals to the individual order and applied pricing terms.
What is the difference between a sales report and a sales dashboard?
A report answers predefined questions in a fixed format. A dashboard lets users explore data across multiple dimensions and drill down into transaction-level detail, making it possible to investigate new questions on the spot.
How do you use a sales report in commercial planning?
By setting targets by account and product category, identifying inactive accounts for win-back campaigns, adjusting price lists based on realized margin, and planning customer migration across channels.
How often should a sales dashboard be updated?
At the cadence of the decisions it supports: daily or weekly for account management routines, monthly for target adjustments, and quarterly for strategic planning.
Read also
- B2B commercial process: what it is, its stages, and where commercial policy fits in
- How to turn commercial policy into automated business rules
- Commercial governance and executable sales policy
About this publication
Article from the blog The Cost of Selling, by CWS Platform, covering B2B commercial operations, management, and planning. It contains no client mentions or specific performance figures.
"responsive, technically engaged, and willing to work through complex commercial rules (negotiated pricing, credit, customer-specific conditions) rather than pushing generic answers"
Is selling more not turning into margin?
Request an assessment of your operation or talk straight to a specialist, whichever you prefer.
I'd rather get the next articles on margin and discounts
A weekly roundup of new articles on margin and discounts, only in weeks when there is one. No spam, and you can leave in one click.