B2B Contribution Margin: How to Calculate Per Order and Customer
Why gross margins slip as top-line revenue scales, and how to automate order-level profit floor rules

TL;DR
- Contribution margin is what remains of an order's revenue after paying for the cost of goods and all the costs that exist only because that order was placed: sales-related taxes, shipping, sales commissions, the financial cost of extended payment terms, channel fees, and returns.
- Calculated per order and aggregated per customer, it reveals why profit margins decline even as top-line revenue grows: the growth was fueled by orders and accounts that contribute very little.
- The calculation fits into a simple seven-column spreadsheet. The real challenge is linking variable costs directly to the specific order, rather than letting them get lost across different departments.
- The practical baseline is using contribution margin per order as an operational floor for discounts and sales channels.
To calculate contribution margin in B2B, take the net revenue of the order and subtract the cost of goods sold along with all variable costs tied directly to that order (freight, commissions, financing costs of payment terms, channel fees, returns). Then, aggregate the orders by customer to determine contribution margin by account. The formula is straightforward. What transforms operations is measuring it at the order level, because that is precisely where margin leaks.
"Why is our margin dropping even as revenue grows?" is the recurring question that hits the finance team whenever a company accelerates digital commerce or opens a new sales channel. Almost always, the answer lies here: volume expanded through orders that cover the direct cost of the product, but fail to cover the cost of serving them.
What goes into the contribution margin
Gross margin focuses on the product. Contribution margin focuses on the order. Beyond the direct cost of the goods, it only includes costs that vary directly with that specific transaction:
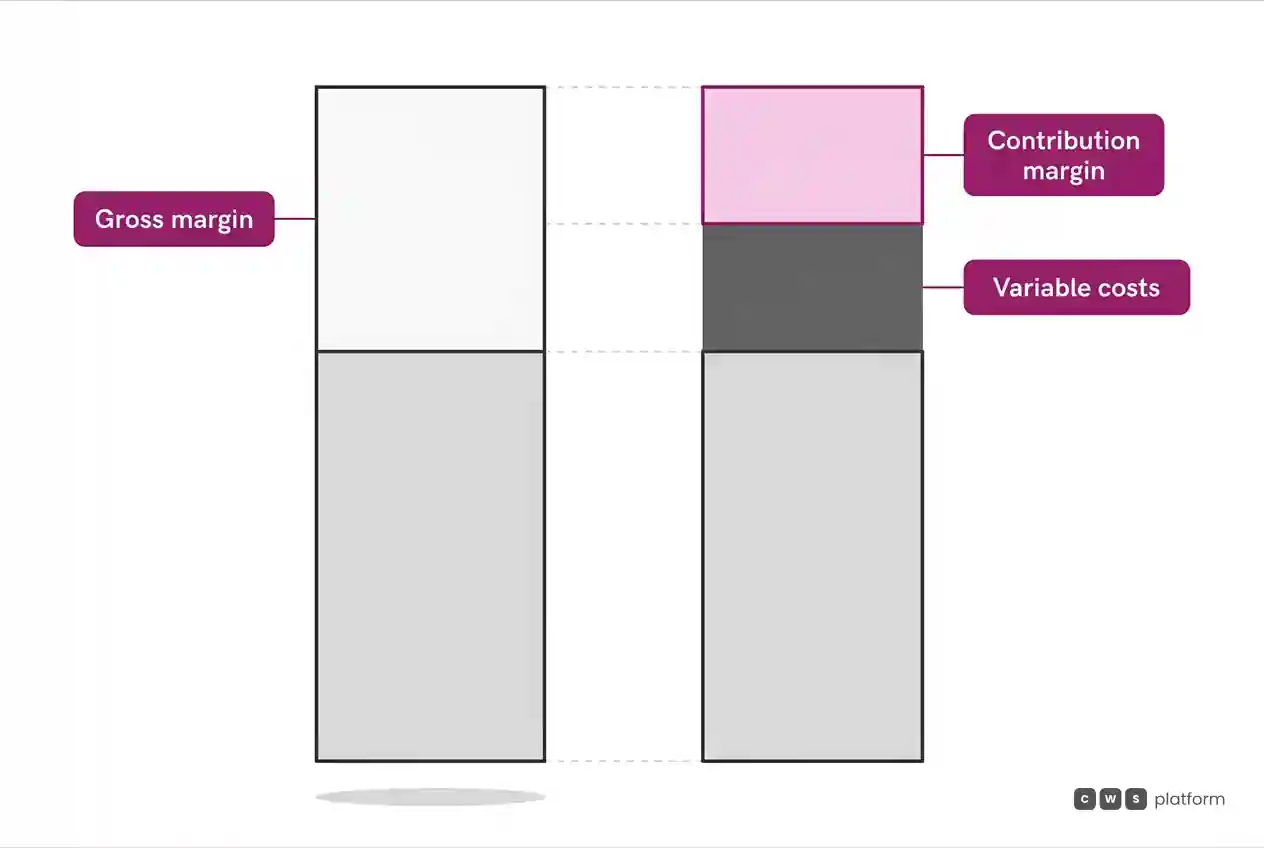
- Sales-related taxes. Direct transaction taxes tied to the invoicing of that order.
- Freight and shipping. The actual delivery cost, including split shipments and express options that were never billed to the client.
- Commissions. Paid to the internal sales rep, external agent, or partner.
- Financial cost of payment terms. Selling on net 90 terms ties up working capital for 90 days, which carries a real cost.
- Channel or payment processing fees. Marketplace transaction fees, credit card processing fees, or factoring costs.
- Returns and allowances. The historical average allowance for that specific customer or product category.
Fixed overhead, such as warehouse leases and corporate administrative salaries, is excluded here. Those expenses are accounted for later, paid out of the pooled total of all order contributions.
Step-by-step calculation per order
Build a single row per order with these columns:
- Gross order revenue.
- Minus direct transaction taxes = net revenue.
- Minus cost of goods sold (COGS).
- Minus freight, commissions, and channel or payment processing fees.
- Minus the financial carrying cost of terms (order value × monthly cost of capital × term in months).
- Minus return provisions and allowances.
- = Contribution margin of the order, expressed in dollars and as a percentage of net revenue.
A hypothetical scenario highlights the impact. Consider two $10,000 orders carrying the exact same product mix and identical gross margins. The first ships consolidated via standard freight on net 30 terms, placed self-service through the customer portal. The second requires three separate split shipments, runs on net 90 terms, and originates from an outside sales channel carrying a commission. Their gross margins are identical. Yet the contribution margin of the second order might be a tiny fraction of the first, and standard revenue reports will completely miss the difference.
How to aggregate by customer
By aggregating all orders for each account across a quarter, the business reveals its contribution margin by customer. Ranked from highest to lowest, the list typically divides into three distinct tiers:
- Accounts that fund the business. High contribution, predictable repeat buying, minimal operational exceptions.
- Neutral accounts. Low, but still positive, contribution.
- Margin-eroding accounts. Frequent small orders, extended terms, non-standard delivery requirements, high return rates. Often, these sit among the largest accounts by top-line revenue.
This follows the exact logic of the cost to serve, viewed through the lens of the order: the customer that appears lucrative based on sheer volume may easily be the most expensive to support.
Why margins fall while revenue grows
With contribution margin per order clearly measured, the diagnosis moves from guesswork to hard numbers. The most frequent culprits:
Discounts scaled alongside volume. Larger order sizes were rewarded with steeper price breaks, but those concessions were never measured against what the order actually yields. This dynamic is explored in growing revenue is not the same as growing margin.
New sales channels carry higher variable costs. Marketplaces, broker networks, or expedited delivery options were introduced without adjusting price structures accordingly.
Product mix deteriorated. Growth was concentrated in low-margin, high-touch SKUs.
Orders became smaller and more frequent. Splitting the same aggregate volume across more individual orders multiplies picking, handling, and shipping costs.
This operational risk escalates when ordering becomes automated, whether through customer portals or AI procurement agents. Without an enforced contribution floor embedded into system logic, digital channels efficiently scale the exact transactions that erode the bottom line.
Moving from calculation to operational rules
Contribution margin transforms business performance only when it becomes an automated business rule enforced during order capture:
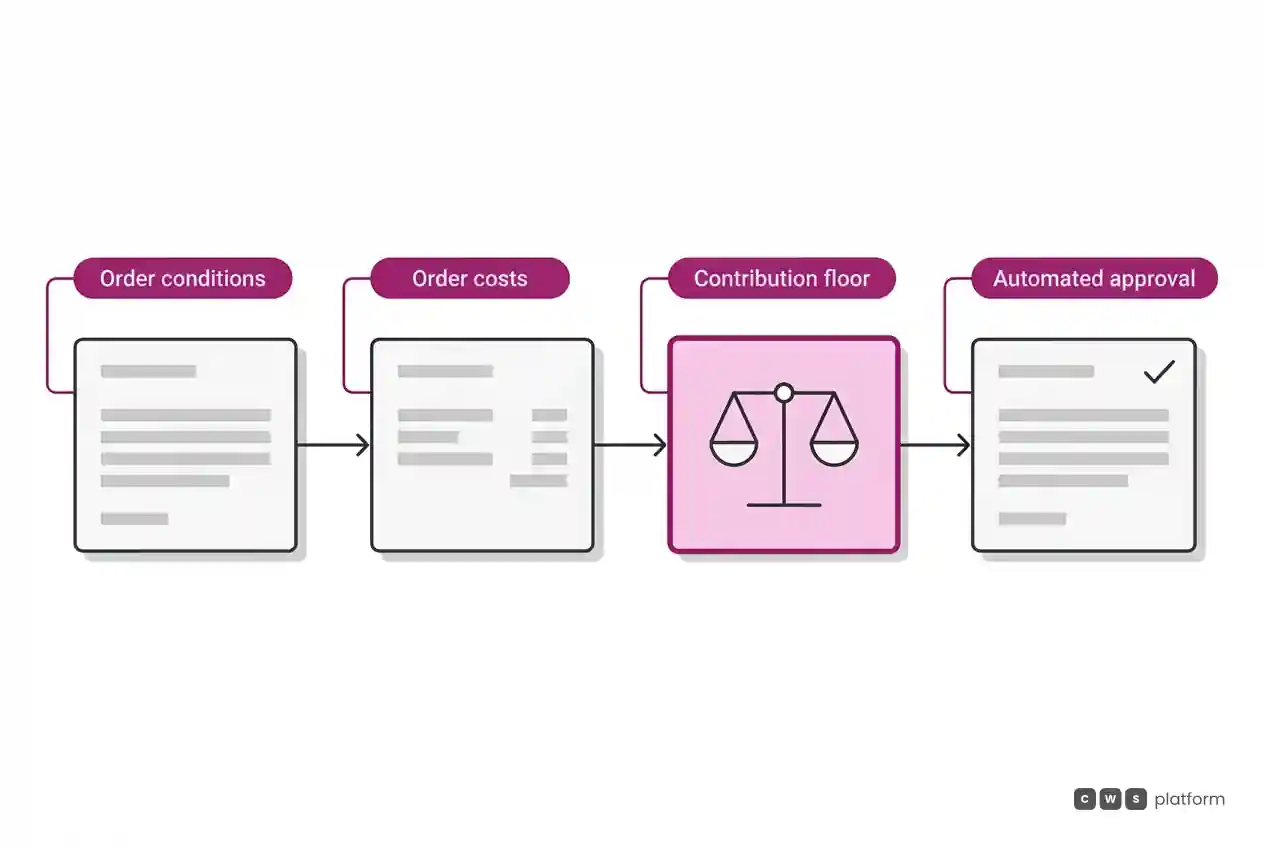
- Contribution-based discount floors. Sales reps retain pricing autonomy as long as the order meets a predetermined minimum contribution margin. Dropping below that threshold triggers an approval workflow.
- Minimum order values (MOV) and freight thresholds. Where small order sizes fail to cover handling, enforcing order minimums or pass-through shipping fees protects profitability.
- Terms-based pricing adjustments. Longer payment terms are treated as priced financing, not an unpriced courtesy.
When these rules are embedded directly into the platform calculating the order, profitability is protected before fulfillment occurs, rather than being diagnosed weeks later during month-end close. This is the precise role of the Pricing Engine within CWS Platform and the framework behind governing discount authorization levels.
Next step
Export the last quarter of order history with revenue, COGS, freight, commissions, and terms, and build the seven columns outlined above. Sort your accounts by total contribution margin. The bottom ten accounts on that list highlight exactly where to begin: pinpointing which minimum order, freight, or payment term policy is systematically failing.
Frequently asked questions
How do you calculate contribution margin?
Take the net revenue of the order, then subtract the cost of goods sold and every variable cost incurred to fulfill that order (freight, commissions, channel fees, the carrying cost of extended terms, and returns). Dividing that figure by net revenue gives the contribution margin percentage.
What is the difference between gross margin and contribution margin?
Gross margin deducts only the direct cost of goods sold. Contribution margin also deducts all variable costs tied to selling and fulfilling the order, accurately showing the true profit left behind by each order and customer.
Why do margins decline even when revenue is growing?
Because the revenue growth originated from orders carrying larger price concessions, higher-cost channels, a lower-margin product mix, or smaller, high-frequency orders that drove up fulfillment costs. Calculating contribution margin at the order level identifies which factor is driving the erosion.
What should you do when contribution margin turns negative?
Reevaluate the commercial terms applied to that account or channel: enforce minimum order sizes, bill for freight, shorten payment terms, or cap discounts. If the contribution margin remains negative after adjustments, the revenue is costing more to fulfill than it is worth.
Further reading
- B2B price setting: from cost structures to customer-specific pricing
- Customer-specific pricing in B2B: applying negotiated agreements without spreadsheets
About this publication
Article from the blog The Cost of the Sale, published by CWS Platform, covering margins and account profitability in B2B. The example provided is hypothetical. It does not disclose client data or specific financial performance figures.
"responsive, technically engaged, and willing to work through complex commercial rules (negotiated pricing, credit, customer-specific conditions) rather than pushing generic answers"
Is selling more not turning into margin?
Request an assessment of your operation or talk straight to a specialist, whichever you prefer.
I'd rather get the next articles on margin and discounts
A weekly roundup of new articles on margin and discounts, only in weeks when there is one. No spam, and you can leave in one click.